Overview
The SmarterScotland package provides a convenient interface for sourcing and interrogating data available through the statistics.gov.scot.
Example
# Data
library(SmarterScotland)
# Visuals and data manipulation
suppressPackageStartupMessages(library(tidyverse))
# Data sourcing
dta_Glasgow_Crime <- get_geography_data(data_set = "recorded-crime",
                                        geography = "Glasgow City",
                                        measure = "count",
                                        pre_process_results = TRUE)
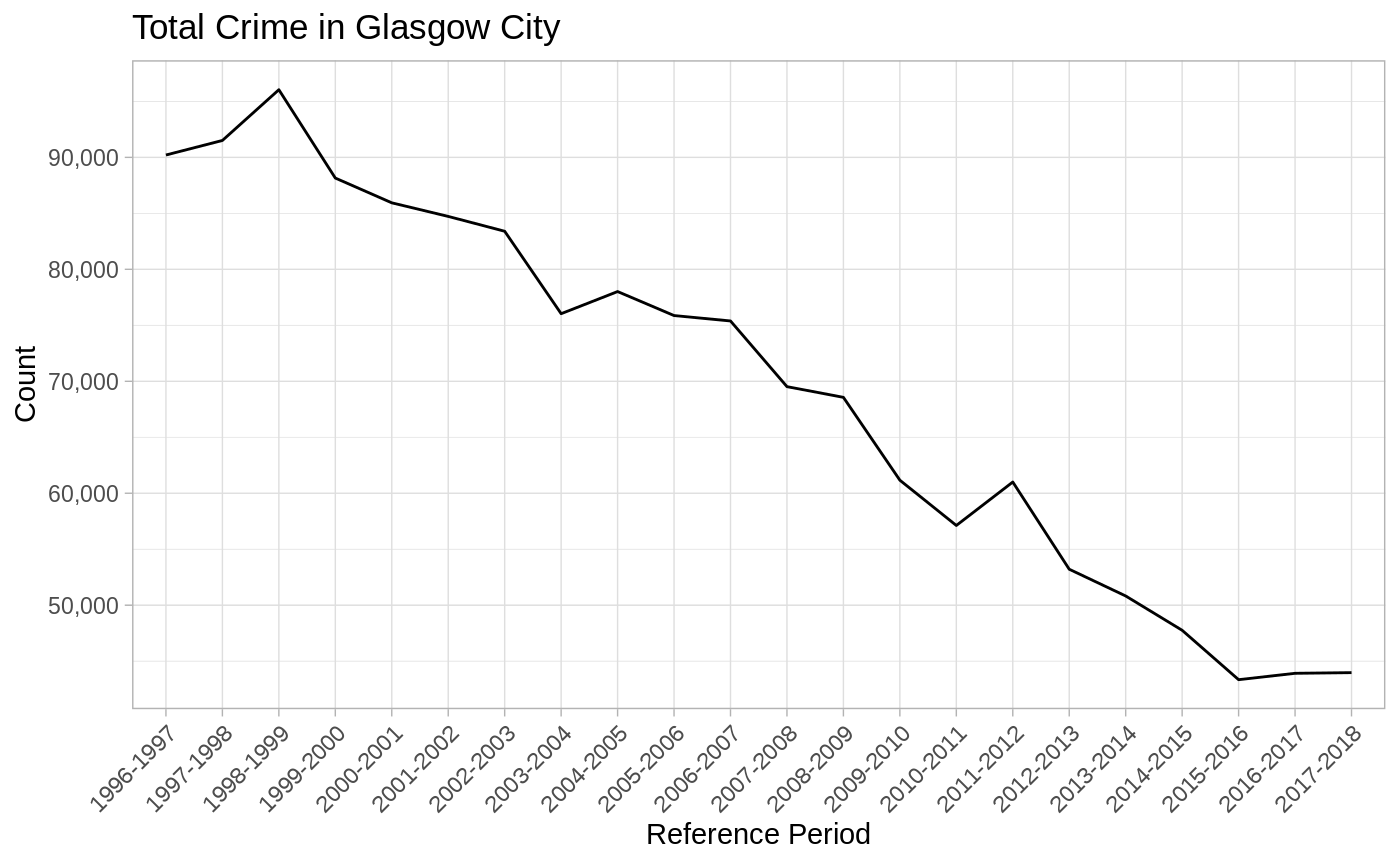
# Summary chart
dta_Glasgow_Crime %>%
  filter(crime_or_offence == "all-crimes") %>%
  select(count, reference_period) %>%
  arrange(desc(reference_period)) %>%
  ggplot(aes(x = reference_period, y = count, group = 1)) +
  geom_line() +
  labs(x = "Reference Period",
       y = "Count",
       title = "Total Crime in Glasgow City") +
  scale_y_continuous(labels = function(x) format(x, big.mark = ",", scientific = FALSE)) +
  theme_light() +
  theme(axis.text.x = element_text(angle = 45, hjust = 1))


